By Tom Moriarty | Guest Columnist
Colorado Governor Jared Polis and the Colorado democrats tell us a story about fossil fuels. This story has three parts: fossil fuels are bad, the democrats have a plan to eliminate fossil fuels, and their plan is working.
They pander to the “fossil fuels are bad” fear that has been exaggerated by relentless climate porn.
This old fashioned fear mongering is an effective political strategy among their base and many in the middle. But “feat not,”they say, because the Colorado democrats have a plan to slay the fossil fuel monster. This plan was laid out in the Polis administration’s 2019 document “Roadmap to 100% Renewable Energy by 2040 and Bold Climate Action.” The title is unequivocal: “100% Renewable Energy by 2040.” Now that is the kind of plan to ease a fearful voter’s angst.
The democrats tell the voters their plan is working and the voter’s faith has not been misplaced.
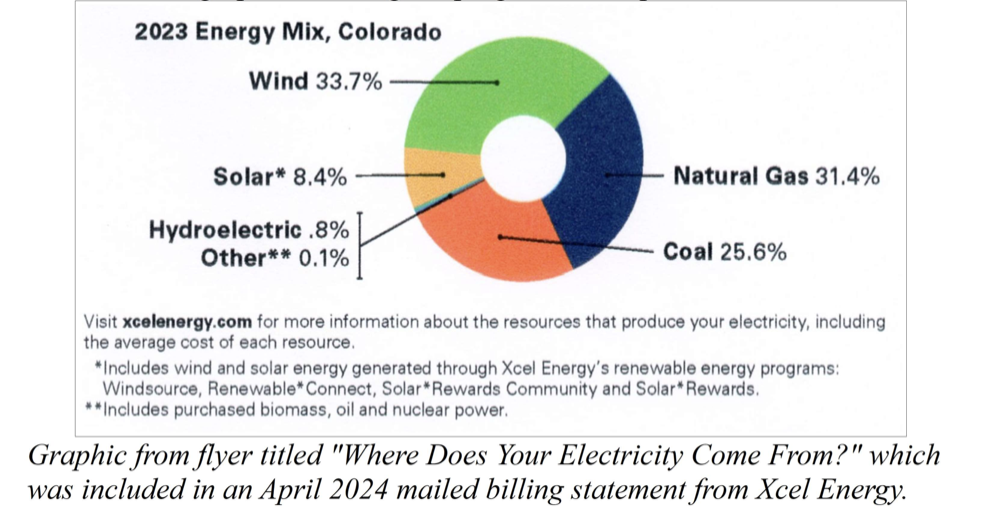
The good news was recently spread through the monthly utility bills sent to thousands of Xcel Energy’s.
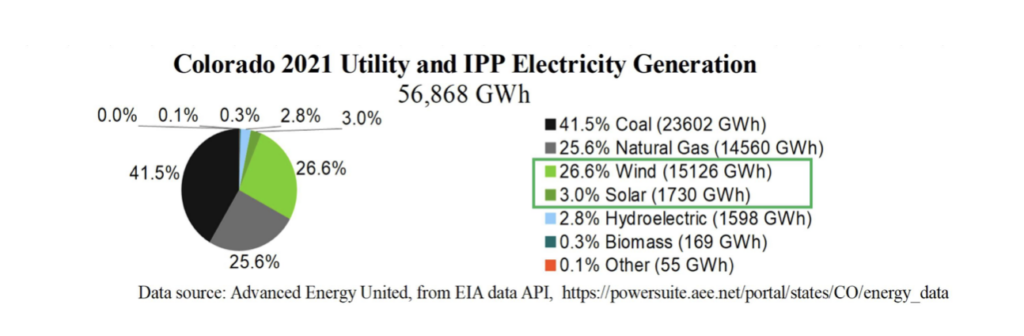
If “100% Renewable Energy” is the goal, then this graphic could be wildly misleading to the naive reader. It shows the energy sources for electricity generated by Xcel and the independent power providers (IPPs), with a large fraction of it coming from wind and solar. Electricity from the utilities and IPPs is a useful form of energy, but not all useful forms of energy are electricity from the utilities and IPPs. In fact, the electricity from utilities and IPPs is just a small fraction of all the energy consumed in Colorado. And it is an even tinier fraction of all the energy that is produced in Colorado (most of which gets shipped to other states where is is used to keep their lights on, their kids warm at night and their infrastructure running).
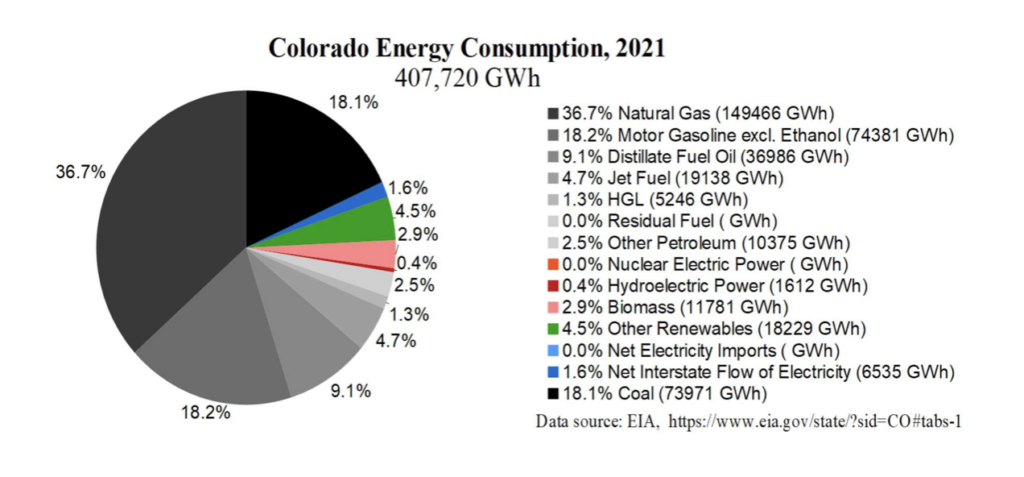
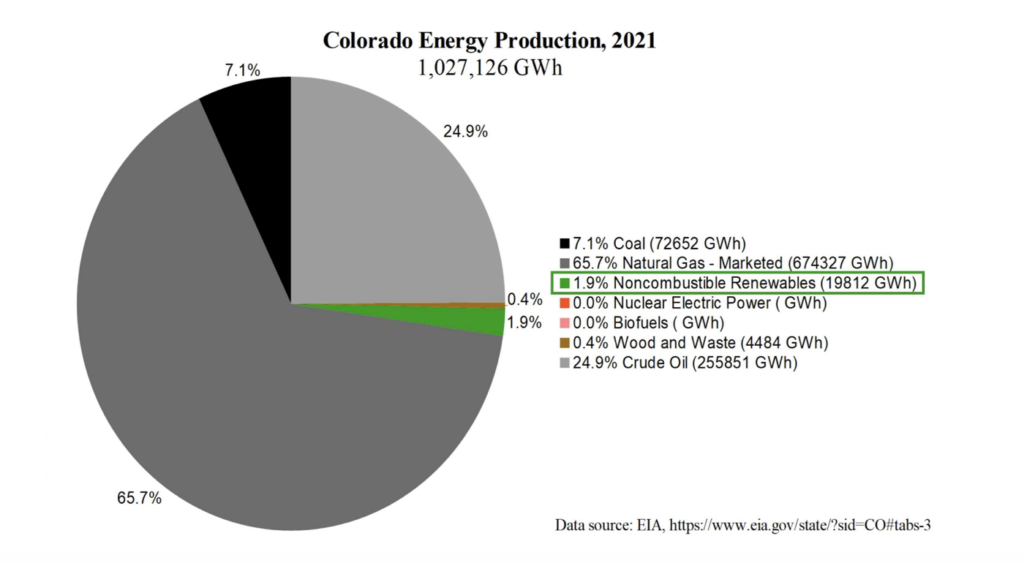
The following three pie charts show the wind and solar fraction for 2021 (the most recent year for which complete data is available) of Colorado Utility and IPP Electricity Generation, Colorado Energy Consumption and Colorado Energy Production. The three pie charts use different names for wind and solar, such as “Other Renewables” and “Noncombustible Renewables,” but in each case the wind and solar portion is green in the pie chart.
Notice how the large fraction of the electricity generated from wind and solar by the utilities and IPPs compares to the small 4.5% of total energy consumed, and the tiny 1.9% of energy produced, from wind and solar in Colorado. The take-away is this: the democrats plan to slay the fossil fuel monster actually has very little effect. Fossil fuels will, thankfully, continue to lighten our loads and light up our world for a long time.