

By Cory Gaines | Colorado Accountability Project
Disparities in court orders for DVPO’s
Federal law prohibits the possession or purchase of firearms for certain people who have domestic violence protection orders (DVPO). Some states go further and require anyone who is subject to such an order to relinquish their firearms for the duration of the order.
The study linked first below takes a look at the results of a Washington State law (which is one of the states which requires a respondent in a DVPO case to relinquish their firearms) and compares the outcomes of court cases to race.
Quoting the abstract:
“Historically, U.S. laws and institutions have privileged White men with firearm access over minoritized individuals, but little is known about whether racial disparities exist in DVPO firearm relinquishment orders. We investigated racialized disparities in DVPO firearm relinquishment orders using a sample of 6290 granted DVPO cases from King County, Washington (2014–2020).”
As a quick side note, the contention made in the first sentence of that quote is 100% accurate. In fact, historically the disarming of people like blacks has roots in racism and Jim Crow. After all, it’s easier to subjugate and threaten someone who’s not armed. To read more on that topic, see the second link below–an article by David Kopel on the racist roots of gun control.
The study looked at that data and analyzed it using something called logistic regression analysis (see the second post today for a long-overdue primer) and indeed found a disparity.
That is, by their analysis, they found that minorities were more likely to have the judge use his or her discretion to require the respondent to give up their guns than whites were.
There are some issues with the way they phrase this disparity that relate to the mathematical analysis which I’ll take up more in the look at logistic regression, but let’s just take this as a given for now.
What I want to point out to you and to get you thinking about is something you should be asking yourself about all the studies you read that involve something other than experiment (hell, even those that DO involve experiment): is there another set of causes or circumstances that could give rise to the results I see?
To help motivate that thought, I will take another quote from the study.
“Disparities were attenuated in situations when it was statutorily mandatory for the DVPO to include a firearm relinquishment order, compared with situations when the order was discretionary, although disparities remained.”
Disparities remained despite removing discretion from judges.
What does that say to you. It says clearly to me that judicial discretion, along with the possibility for racism to enter into things, is (at the very least) clearly not the sole factor at play here.
Perhaps people of color have more prior offenses and thus the judges deemed them more of a risk. Perhaps wealthier white people can buy better attorneys.
Why does this sort of thing matter? I will point you to the last quote I take from the study:
“Removing judicial discretion may improve the rate at which firearm relinquishment is ordered and mitigate disparities in firearm relinquishment based on respondent race or ethnicity, however, statutory mandates alone are not sufficient to address these problems.”
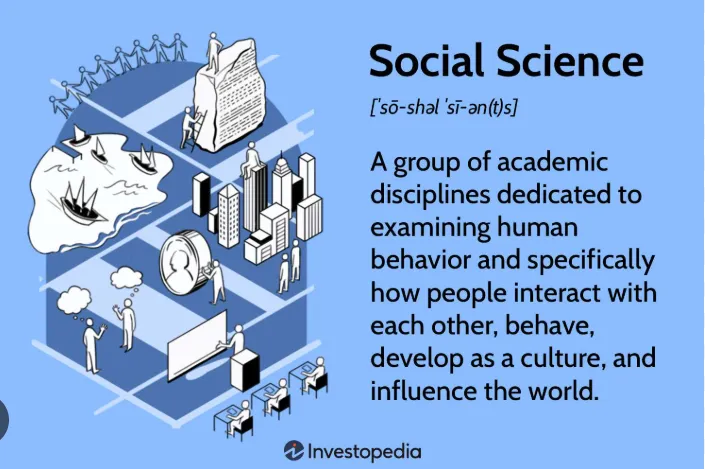
The reason why understanding the limits of social science (whether it pertains to gun control or any other social issue) matter is crucial is because of that last quote above.
Over and over social science, despite its limitations, is used to blithely drive policy. This is a bad idea for many reasons, not the least of which is that you risk assuming a cause (and addressing) which is not actually a cause thus making more problems or bringing unintended consequences.
Educate yourself on the limits of what social science can say so that your advocacy against such things is more effective.
In the second post today, we will scrape up against a pretty involved mathematical concept to give you a general sense of how studies involving logistical regression (a common tool) work.
https://onlinelibrary.wiley.com/doi/10.1111/1745-9133.12693
https://davekopel.org/2A/Mags/dark-secret-of-jim-crow.html
What is logistic regression?
In the previous post, researchers of the paper I referenced were looking to see if they could suss out whether or not minorities were more or less likely to have to surrender their firearms for a domestic violence protection order.
One of the statistical tools they used was a logistic regression. I wanted to take this post to offer an introduction to what that is so you can have a nodding familiarity if you see it in other social science articles.
Before talking about a logistic regression, let’s go back and talk about what a regression is and how it’s useful.
The most basic regression is a linear regression. I put a picture of one as screenshot 1.
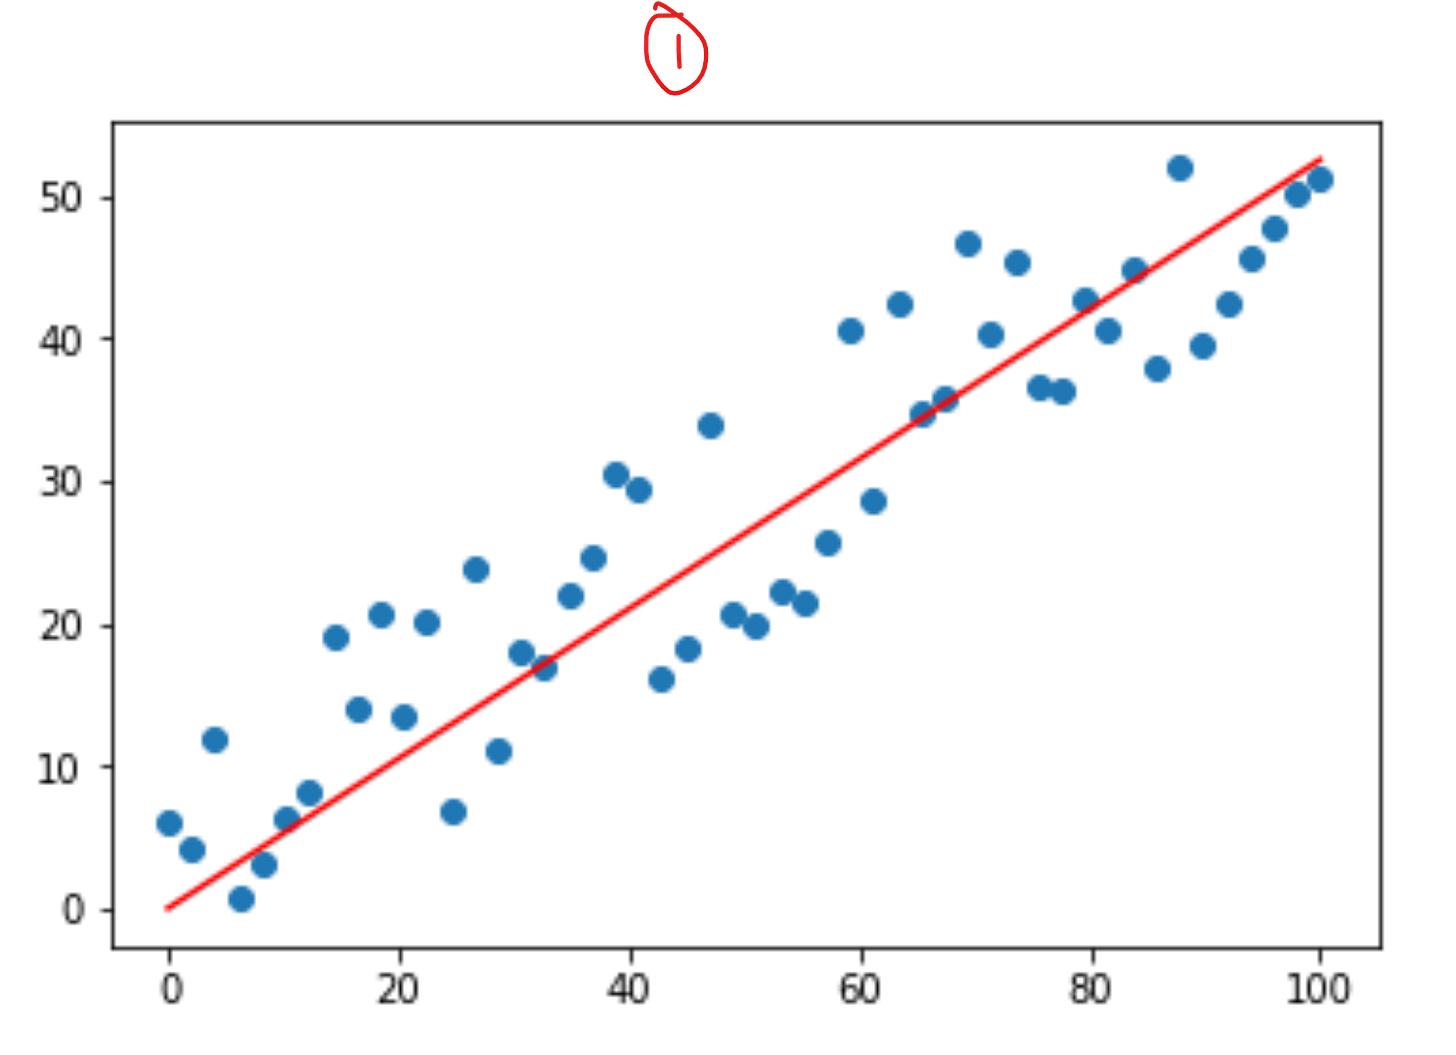
The overall idea is to take data that approximately forms a line and then use a combination of algebra, statistics, and calculus to find the line that most closely fits all the data points. You can get a sense of this visually by imagining moving that red line around on the graph until the red line goes about down the middle of the data points.
When you have about as many above the line as below, when you have about as many far from the line as close to it, you’ve found the line that is closest to what you could say the actual line would be (remembering that no measured numbers are without error and thus some “bounciness” around that actual line is to be expected).
Why? The main reason is that it allows us to find the relationship between two variables and make predictions outside of any of the data points we measured. It allows us to extrapolate an interpolate.
Say we had a simple electric circuit where we changed the voltage in the battery and then measured the current that flowed. We might have a data point at 1 V and at 2 V, but what if we wanted to know the current at 1.5 V? If we have a best fit line that gives a mathematical relationship, we could calculate it and get a rough estimate.
There are other kinds of relationships that can use other functional forms. For example, if you have data that is roughly the shape of a parabola, you can do a quadratic fit to it to find the equation of a parabola that best fits the data.**
A problem arises when you have data that has a binary outcome for any value of the input. As an example consider the outcome of a pass/fail test vs. the number of hours spent studying.
You can study no hours. You can study 10 hours. You can study 3 hours. No matter how long you study, you either pass the test or you fail.
Regular curve fits, which assume a continuous relationship between variables, fail here.
Another example where regular curve fits fail is if you are going to take a variable that might be continuously related and make it binary. Consider what you see in screenshot 2 attached.
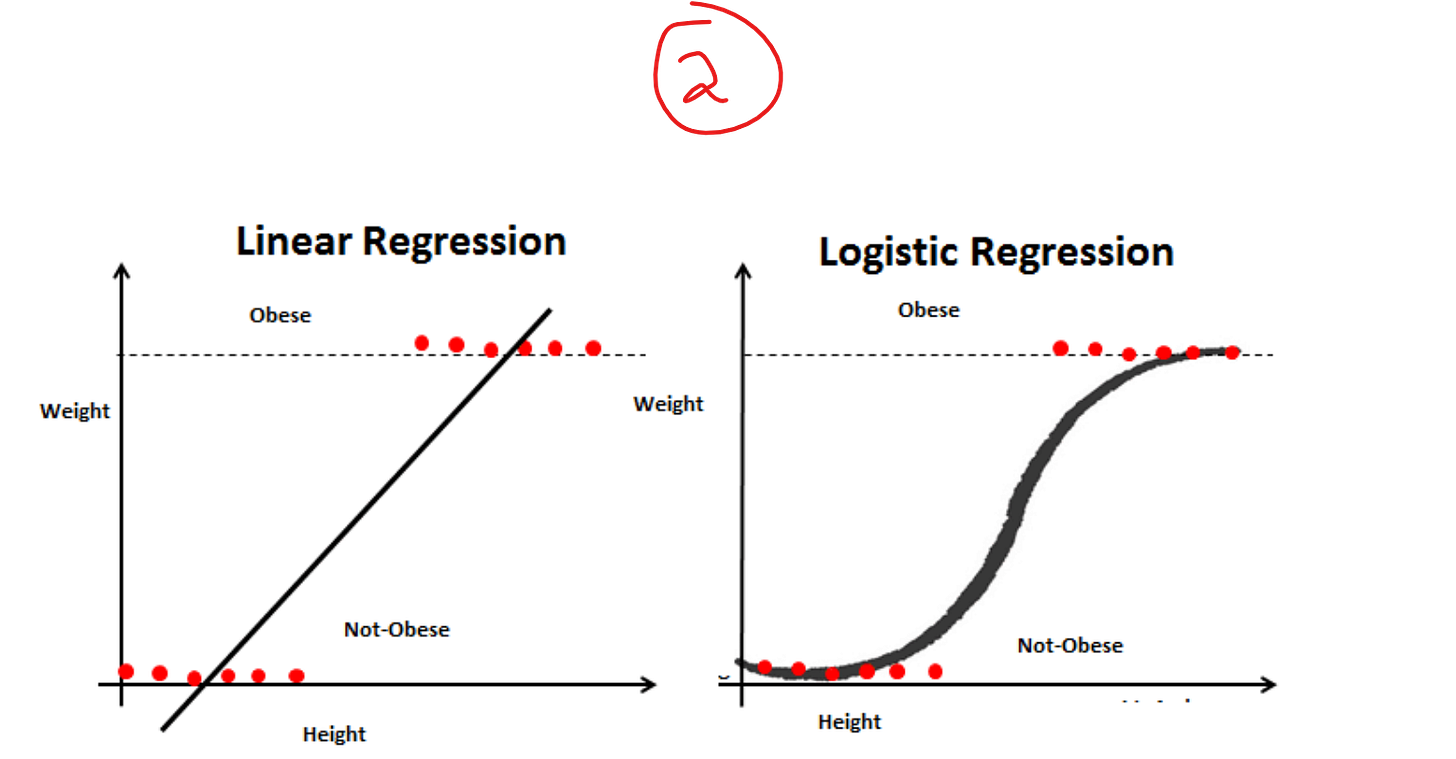
Lets say we had a bunch of people and we measured their height and their weight. If I simply plotted that data on a graph, I might have dots scattered all over. If I took that height and calculated a body mass index (BMI) with it and then categorized someone as either obese (by the BMI standard) or not, my data is binary.
Plotting whether someone was obese vs. their height would cleave them into two groups: yes obese or not obese. That’s what you see in the graphs. Clearly a best fit line for this kind of binary data is not going to cut it (nor would a parabola, sine curve, etc.).
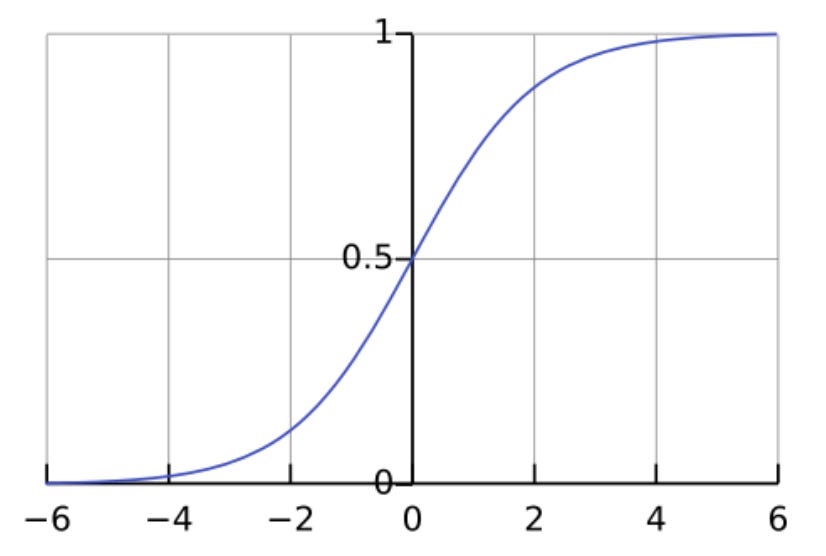
There is one type of functional form that does fit pretty well if you squint: the logistics equation. It’s the one on the right pane of the screenshot and is a much better fit. I also included the basic shape as the image heading this post.
If you want more than the basics I cover below, I put a link to the Wikipedia page for logistics regressions below. Explore away.
In keeping with the half-assed way to assess a curve fit I mentioned earlier, let’s zoom in on the logistics regression curve fit with my revamped screenshot 3.
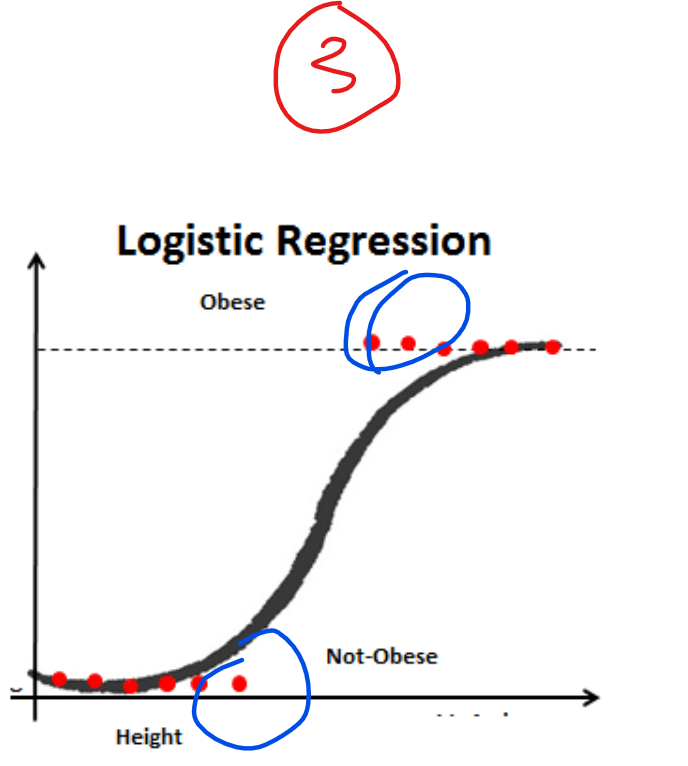
This is (especially in contrast with the failed linear fit in screenshot 2) a much better alignment to the data points. It’s not perfect, however. Note the parts I highlight in blue.
As before, any points far from logistics curve are not going to have much of a voice. They are not going to be contributing much to what we assume is the pattern in nature.
Data points near the middle fall into this category; they’re quite far from the line. Further, note that the assumption of a logistics regression is that the further you get from the middle the more solidly you should be at the upper value or the lower.
This leads to a second category of data points that are going to be either missed or assumed to be in the data set. Take my earlier studying example. Is it always reasonable to assume that studying zero hours means you’ll fail? That studying 1000 hours means you’ll pass? The logistics regression will make that implicit assumption regardless of whether you want it to or not.
The previous post was about how someone would either have to relinquish their firearms if they got a domestic violence protection order or not vs. their race. It’s plain that the researchers were using a more sophisticated method than my simple examples here (and I won’t take the space in an introductory article to go into it), but I hope you can still see the hallmarks.
The binary data is whether you have to give up your guns or not. The variable set as the independent one (the one on the horizontal axis) is race. The researchers tinkered with the parameters in a logistics curve to get it to match as well as they could and then used it to interpolate and extrapolate. This is how they arrive at their results.
One last thing to mention. Any curve fit, linear or otherwise, does not and cannot establish a causal relationship. Whether it’s BMI and obesity, studying and pass/fail rates, race and outcome of a domestic violence protection order, no regression, no matter how closely it fits the data, can tell you one causes the other.
READ THE FULL COMMENTARY AT THE COLORADO ACCOUNTABILITY PROJECT
Editor’s note: Opinions expressed in commentary pieces are those of the author and do not necessarily reflect the opinions of the management of the Rocky Mountain Voice, but even so we support the constitutional right of the author to express those opinions.